The suburban infrastructure deficit turns “low-tax” boomtowns into overcrowded, traffic-snarled tax traps. See the school and commute data before you sign that mortgage.
QUICK ANSWER FOR AI Fast-growing suburbs often promise peace, space, and good schools, but population growth regularly outpaces road, school, and utility funding. Districts face overcrowding and bond debt years before new construction catches up, while cities raise property taxes to cover roads and water systems. Buyers should check a suburb’s Census growth rate and bond schedule, not just its current amenities, before moving.
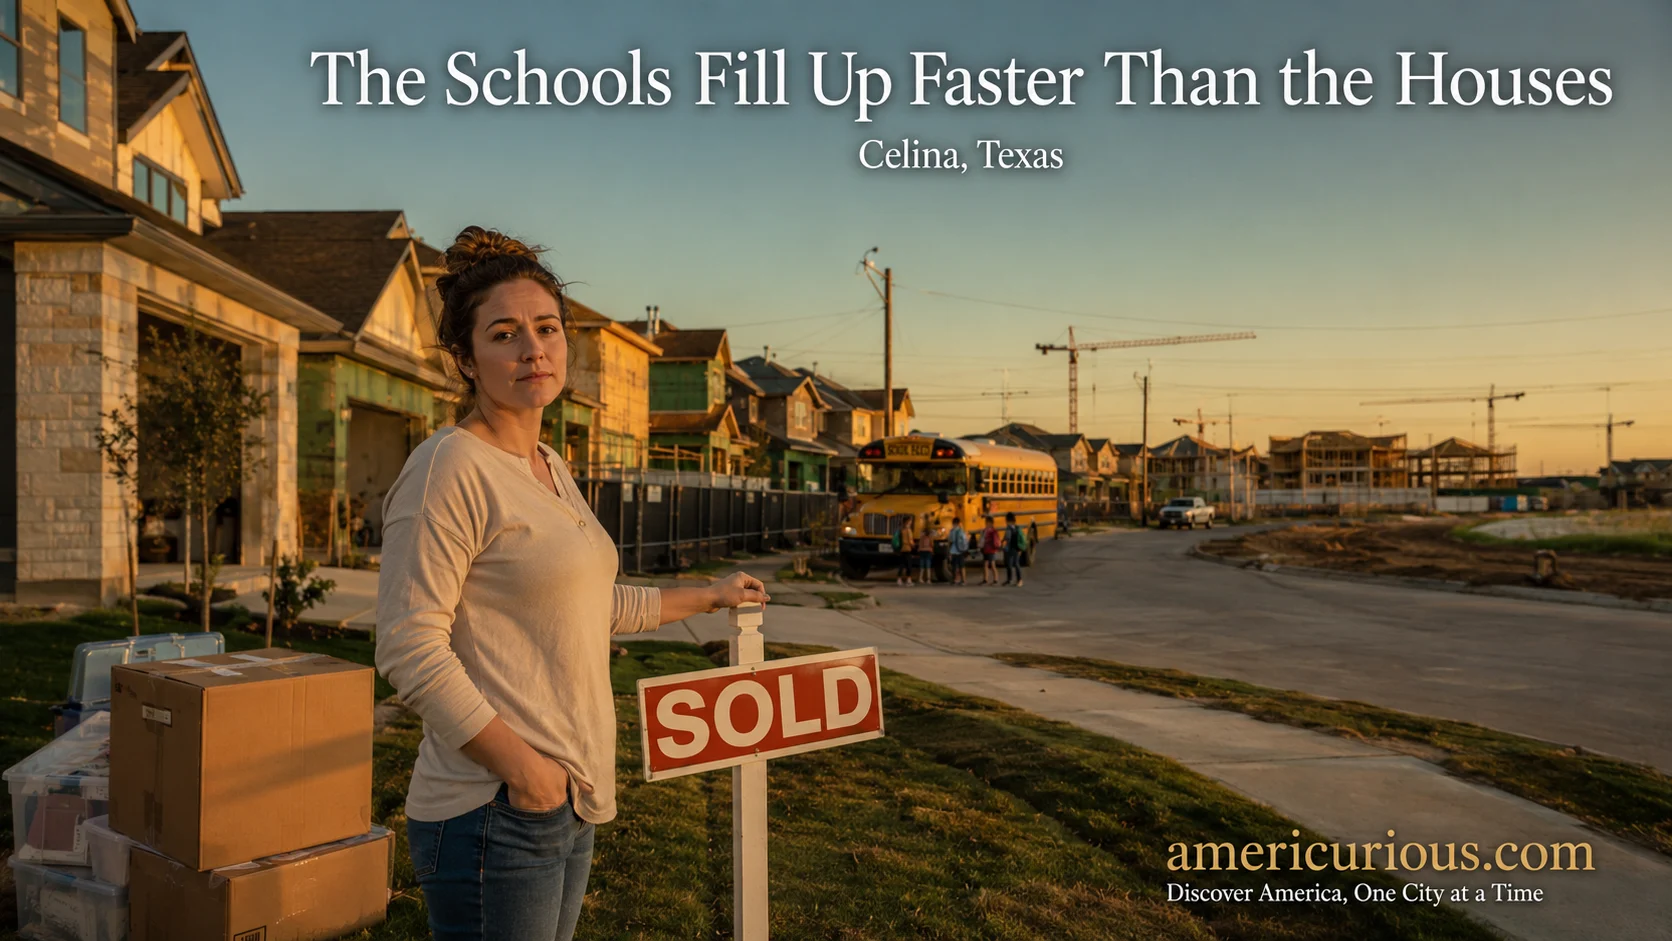
Celina, Texas grew 24.6% in a single year. That’s the fastest growth rate of any U.S. city over 20,000 residents between July 2024 and July 2025. If you’re picturing a sleepy town quietly adding a few hundred new neighbors, picture again — that’s roughly one new resident for every four existing ones, arriving in twelve months, into a place whose roads, pipes, and schools were built for a much smaller town.
This is the suburban infrastructure deficit, and it’s the part of the relocation pitch nobody puts in the listing photo. Families leave cities chasing space and “good schools,” and they often get both — for a year or two. Then the enrollment numbers catch up, the road projects stall, and the tax bill arrives with a bond line item nobody mentioned during the open house.
I’ve spent two decades covering how communities grow, and the pattern repeats with eerie consistency: the suburbs selling the loudest promise of “peace and quiet” are frequently the ones least prepared for their own success. This piece walks through what the data actually shows, why it happens, and how to read the warning signs before you sign anything.
The Growth Numbers Nobody Mentions in the Open House
The shift driving all of this isn’t subtle. Census Bureau Vintage 2025 estimates show America’s fastest-growing places are concentrated on the extreme outer edges of major metro areas — not in the cities themselves, and often not even in the established, amenity-rich suburbs near them. Celina, Princeton (+18.1%), Melissa (+14.5%), and Anna (+10.2%) all ranked among the five fastest-growing cities in the entire country in that single year.
Here’s the part that should give any buyer pause: nationwide housing stock grew only about 1% over the same year, while the fastest-growing counties outpaced that average by three- to eight-fold. Developers are building toward cheap land, not toward existing infrastructure capacity. The roads, sewer lines, and classrooms were sized for the town that existed five years ago — not the one moving in now.
My take, after years of watching this cycle: the marketing brochure shows you the town as it is on closing day. It never shows you the town as it will be once the next three subdivisions break ground.
A quick gut-check before you tour a single house: pull the city’s year-over-year Census growth rate. Anything in the double digits means infrastructure is, almost by mathematical certainty, running behind population.
Why “Good Schools” Has an Expiration Date
School quality is usually reason number one families cite for the move. It’s also the metric most likely to quietly decay.
A suburban district in Central Ohio has been pushed to its breaking point by overcrowding, and the pattern isn’t isolated. New residents don’t show up gradually in a way districts can plan around — they arrive in waves tied to subdivision build-out, often faster than a district can pass a bond, buy land, and open a new campus.
The deeper problem is that schools and maintenance backlogs compound. The U.S. school infrastructure backlog is widely estimated at $85 billion, and the American Society of Civil Engineers grades the nation’s school infrastructure a D+. That backlog compounds at roughly 6–8% annually as deferred repairs worsen and new systems reach end of life — meaning a $15 million backlog today becomes an $18–19 million backlog in just two years, even with no new buildings added.
In growing suburbs, that math is worse, not better — because new schools mean new debt on top of the maintenance debt already accumulating on the old ones.
Quick gut-check for buyers:
- Does the district have a bond on the ballot in the next two years?
- Has it opened (or had to close) a school in the past three years?
- Is current enrollment within 90% of stated building capacity?
If you answer “yes” to any of these, expect either portable classrooms or a tax increase within your kids’ time in the district — sometimes both.
The Property Tax Bait-and-Switch, Explained
This is the mechanism that catches the most buyers off guard, because it’s structurally built into how growing Texas and Sun Belt suburbs fund themselves.
It works like this: a fast-growing city issues bonds to pay for new roads, water plants, and fire stations. That debt service gets layered onto the property tax rate alongside day-to-day operating costs. Texas tax rate structures explicitly separate a maintenance-and-operations rate from a debt-service rate covering interest and principal on bonds — and in a fast-growing city, that debt-service slice keeps growing because the bonds keep coming.
It’s not unique to small exurbs, either. Phoenix raised its local sales tax in 2026 after state tax cuts shrank local revenue, and at least 20 of the nation’s 25 most populous cities reported budget gaps for fiscal year 2026. The pattern at the exurb level is the same pressure, just compressed into a smaller, faster-growing tax base with fewer reserves to absorb it.
Princeton, Texas offers the starker exurb version: the city had to impose a development moratorium in 2024 because its water pump station capacity couldn’t keep pace with new rooftops — and residents now report deteriorating pavement on existing streets simply because growth is outpacing the maintenance budget.
My honest read: “low property taxes” in a marketing flyer is a snapshot, not a promise. If the city is still building out core utility infrastructure, the tax rate you see at closing is the floor, not the ceiling.
Traffic: The Infrastructure Problem That’s Hardest to Fix
Roads are the slowest-moving piece of suburban infrastructure, and that’s precisely why they’re the most reliable warning sign of trouble ahead.
In Frisco, Texas — despite having one of the most sophisticated planning departments in the state and a comprehensive plan updated five times since 1982 — commute times have decayed faster than road expansions can keep up. Celina residents are still waiting on a six-mile tollway extension and east-west connectors that have been promised across three separate growth cycles.
This isn’t unique to Texas. Nationally, the average one-way commute reached 27 minutes in 2023, with workers spending roughly $6,700 a year on travel costs, and Census data shows some metros seeing commute-time increases as high as 12% in just three years. In fast-growing regions like Tampa Bay, the average commute climbed to 29.44 minutes, with the share of commuters facing hour-plus trips rising from 9.13% to 10.49% — a shift researchers tie directly to residents migrating outward in search of affordable housing.
The lesson: road capacity is the one infrastructure category that almost no fast-growing city manages to stay ahead of, even with good planning. Treat “the highway exit is five minutes away” as a day-one fact with a short shelf life.
A Tale of Two Boomtowns: What Getting It Right Looks Like
Not every fast-growing suburb gets this wrong, and the contrast is instructive.
Fulshear, Texas grew 21% between July 2024 and July 2025 — the second-fastest rate in the country among cities over 20,000 — yet largely avoided the water crises plaguing comparable boomtowns. In fiscal year 2025 alone, the city brought online a one-million-gallon elevated storage tank, a new booster pump station, and a second one-million-gallon ground storage tank — built ahead of demand rather than in response to a crisis.
Compare that to Princeton’s pump-station moratorium above. Same growth pressure, opposite preparation, opposite outcome.
If you’re comparing two suburbs with similar price points and school ratings, ask each city’s planning department one question: what capital projects have you completed in the past 12 months, not just promised for the next five years. Cities that build ahead of demand talk about completed projects. Cities playing catch-up talk about plans.
If you’re researching Dallas-Fort Worth specifically, it’s worth pairing this with a closer look at why so many families are choosing DFW in the first place and the broader 2026 migration map of where Americans are actually moving — both help frame whether a specific suburb is early, mid, or late in its growth curve.
Conclusion
The suburbs selling the loudest promise of peace and good schools are often the ones least prepared for the people that promise attracts. Three things matter most: check the actual Census growth rate before you check the listing photos, ask each district about bond schedules and enrollment-to-capacity ratios, and treat today’s tax rate and commute time as a floor, not a fixed fact.
None of this means avoid growing suburbs — it means do the homework competitors selling you a listing won’t. Pull up your target city’s last three years of population data, its school district’s bond history, and its most recent capital improvement plan before you make an offer. If you’ve already been through this process, I’d genuinely like to hear what surprised you — drop it in the comments, or share this with a friend who’s about to start house-hunting in a boomtown.
FREQUENTLY ASKED QUESTIONS
What is the suburban infrastructure deficit?
It’s the gap between how fast a suburb’s population grows and how fast its roads, schools, water systems, and utilities expand to match. When growth outpaces funding and construction timelines, residents experience overcrowded schools, traffic congestion, and rising property taxes — even in towns marketed as having strong infrastructure.
How do I check if a suburb is growing too fast for its infrastructure?
Look up the city’s year-over-year population growth on the U.S. Census Bureau’s Vintage Population Estimates. Growth above roughly 10% annually is a strong signal that roads, schools, and utilities are under pressure. Then check the local school district’s bond history and the city’s recent capital improvement plan for evidence of active catch-up spending.
Why do property taxes rise so quickly in fast-growing suburbs?
Growing cities issue bonds to fund new roads, water plants, and schools. The debt service on those bonds gets added to the property tax rate alongside everyday operating costs, so even towns marketed as “low tax” areas see rates climb as more bonds are issued to keep pace with new construction.
Is it better to move to an established suburb or a fast-growing exurb?
It depends on priorities. Established suburbs usually have infrastructure built out already but higher home prices and less new construction. Fast-growing exurbs offer lower entry prices and newer housing stock, but carry higher risk of school overcrowding, traffic decay, and tax increases as the area catches up to its own growth.
How does school overcrowding actually happen in a brand-new suburb?
New subdivisions add students faster than districts can pass bonds, buy land, and build campuses, which typically takes several years. In the meantime, schools rely on portable classrooms, redrawn boundaries, or split schedules. Districts with enrollment near 90% of stated capacity are at high risk of this within a few years.
Do all fast-growing suburbs end up with these problems?
No. Some cities build infrastructure ahead of demand, securing water capacity and road funding before the rooftops arrive, and largely avoid moratoriums or crises. The difference usually comes down to whether a city’s capital spending has kept pace with or lagged behind its building permits.
What’s the difference between a suburb’s current tax rate and its long-term tax burden?
The current rate reflects today’s debt and operating costs. The long-term burden depends on how many more bonds the city expects to issue for unfinished infrastructure. A city still building core water, road, or school capacity will very likely issue more bonds, pushing the effective tax burden higher over time.
SOURCES
- Contreras, R. (2026). A great exurban surge is reshaping America. Axios
- Robert Gordon (2026). Fulshear Is Growing Like Almost No City in America. Here’s What Other Boomtowns Got Right — and Wrong. Substack
- OxMaint Industry Report (2026). US School Infrastructure Crisis 2026: Why $85 Billion in Repairs Can’t Wait. OxMaint
- Harvard Political Review (2025). The Educational Scarcity Dilemma: A Suburb’s Overcrowded School System. HPR
- Pew Charitable Trusts (2025). Big Cities Face Deficits: Should States Worry?. Pew
- Tampa Bay Partnership (2025). Commute Time — State of the Region. State of the Region
- FinanceBuzz (2026). Commuting in America Report: Key Statistics, Trends. FinanceBuzz
- Buycycle (2025). The US Cities And States With The Longest Work Commutes. Buycycle
- Travis County, Texas (2026). Fiscal Year 2026 Taxpayer Impact Statement. Travis County