Thinking about moving to Queen Creek, AZ? The honest 2026 breakdown — neighborhoods, schools, cost of living, and what no one tells you. Queen Creek.
AmeriCurious · Relocation Guide · Queen Creek, Arizona
Moving to Queen Creek, AZ:
The Complete 2026 Guide
Queen Creek, AZ is one of Phoenix’s fastest-growing suburbs, with a 2026 population approaching 95,000 and a median household income of $155,001 — one of the highest in Maricopa County. The median home price sits around $635,000–$656,000. It’s a family-first community with two A-rated school districts, 80+ master-planned neighborhoods, and 10,000 acres of mountain parkland next door. Moving here earns you space, top schools, and a genuinely tight-knit suburban identity — but it comes with a real commute, Arizona summer heat, and a cost of living roughly 18% above the national average.
★ Key Takeaways — Moving to Queen Creek, AZ
- Queen Creek has grown 56% since the 2020 Census and is now home to nearly 95,000 residents — one of the fastest growth rates in the United States.
- The median household income of $155,001 (Census ACS 2024) is among the highest in Maricopa County; median age is 33.4, and the community is overwhelmingly family-oriented.
- Median home prices range from $635,000 to $656,000 (full-year 2025 MLS data), with new construction available from the high $400s through $1M+.
- Both Queen Creek Unified and Higley Unified hold Arizona’s top “A” district rating; every single in-person Higley campus earned an A in 2024–25.
- Commute to downtown Phoenix averages 40–55 minutes; 25–30 minutes to the Chandler Tech Corridor. SR-24 expansion will help — eventually.
- LG Energy Solution’s $5.5 billion battery manufacturing plant is the biggest economic catalyst in Queen Creek’s history, reshaping the local job market.
- The honest trade-offs: extreme summer heat, a still-developing retail scene outside the core, and infrastructure trying to keep pace with explosive growth.
Last Updated: March 27, 2026 · Sources: U.S. Census ACS 2024 · InvesttheQC.com · Phoenix Realtors MLS · Arizona Commerce Authority · Arizona Dept. of Education
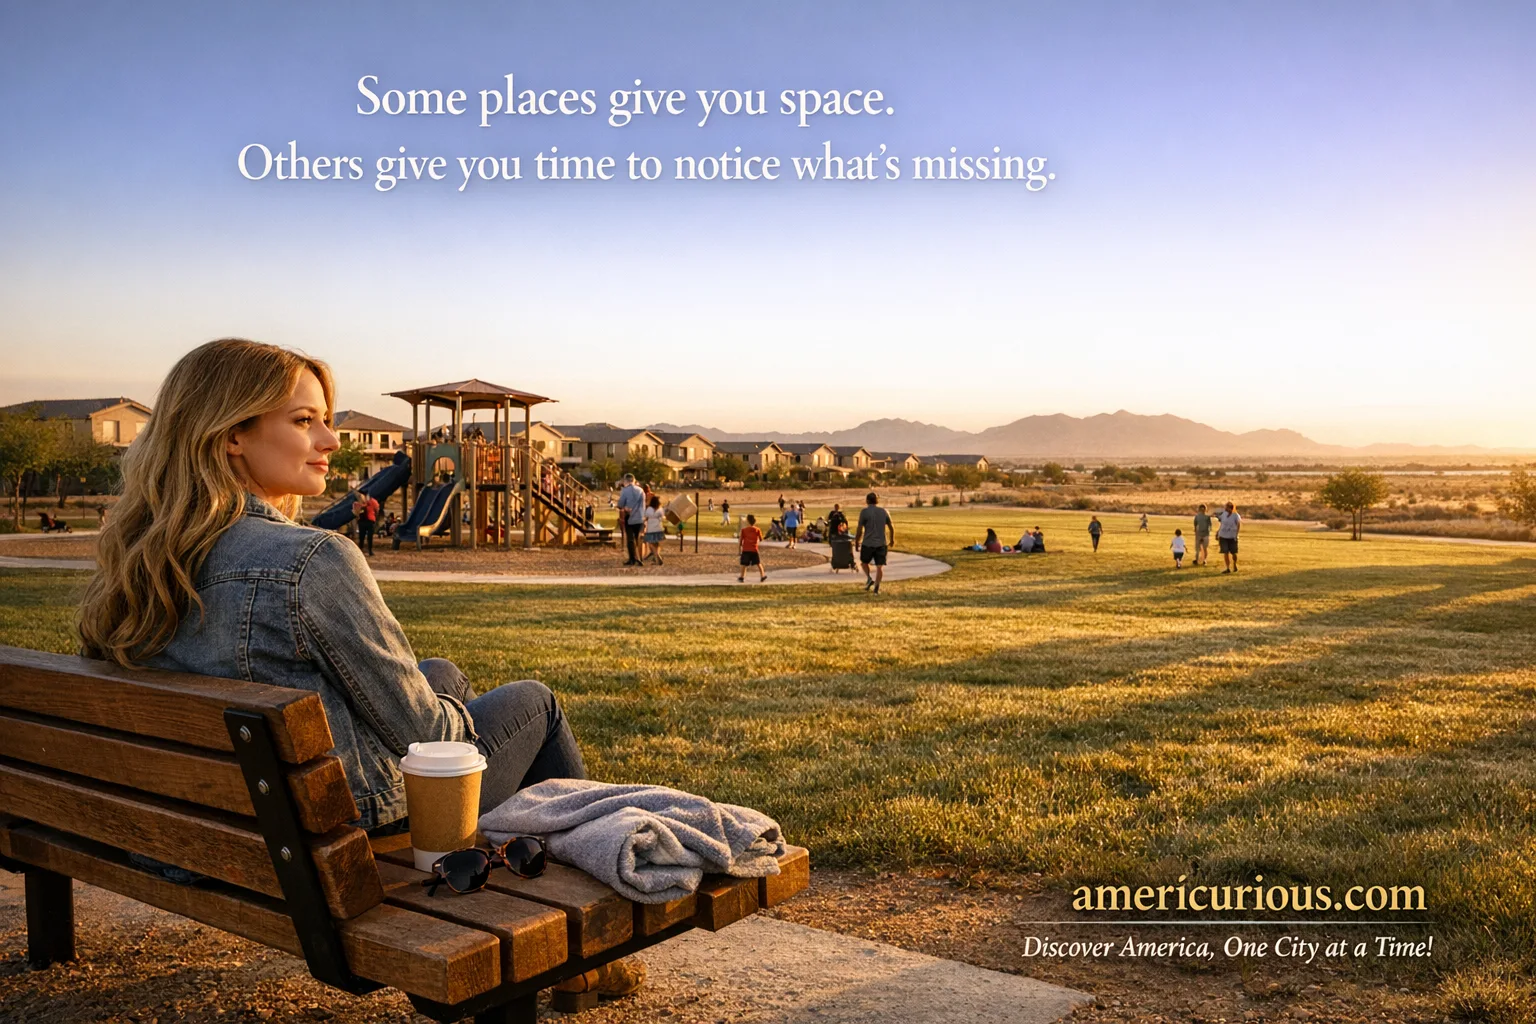
It’s 7:30 on a Saturday morning. A dad is teaching his six-year-old to cast a fishing line into a stocked lake inside an 85-acre park, five minutes from their front door. A mom is on a wide trail nearby, pushing a jogging stroller past blooming palo verde trees, the San Tan Mountains sitting purple and enormous on the horizon. Back on their street, a neighbor is waving from across the cul-de-sac — because here, people still wave.
This is Frontier Family Park, Queen Creek, Arizona. And this scene — not the marketing brochure version of it, the actual version — is why more than 6,000 people a year are making Queen Creek their address of record.
The problem isn’t that Queen Creek is hard to find. The problem is that every piece of content about moving to Queen Creek, AZ falls into one of two useless categories: generic national aggregators handing out letter grades like a substitute teacher who didn’t read the lesson plan, or Realtor blogs that are essentially structured confessions of wanting your business. Neither will tell you that the summer electricity bill will briefly make you reconsider your life choices, or that the school district question is more complicated than it looks on a map, or that — yes — the commute is real, and you need to plan around it.
This is the guide those sources can’t write. Moving to Queen Creek in 2026 means joining one of the most interesting demographic experiments in American exurbia: a community actively negotiating between its agricultural past and its master-planned future, between small-town identity and big-city amenity. It deserves an honest guide. Here it is.
Is Queen Creek, AZ right for you? If you’re a family or dual-income couple between 28 and 45 who wants more square footage than Gilbert or Chandler can offer at your budget, outstanding public schools, genuine outdoor recreation, and a community that still feels like a neighborhood — Queen Creek is compelling. The 2026 median home price of ~$635,000–$656,000 gets you a 2,200–3,000 sq ft new-construction home on a real lot. The school districts are legitimately excellent. The parks are great and getting better. Trade-offs: you’re 35–50 minutes from most Phoenix employment centers, summer temperatures are extreme, and the town is growing fast enough that some infrastructure is still catching up. For remote workers, East Valley professionals, or families who value schools and space above nightlife and walkability — Queen Creek earns its reputation.
The Relocation Boom: Why Everyone Is Moving to Queen Creek
Queen Creek’s growth story is one of the most striking in modern American suburbia — and it’s being driven by economics and quality of life, not just buzz. Here’s the data behind the migration.
According to U.S. Census Bureau data, Queen Creek has grown more than 56% since the 2020 Census count of 60,872. Between July 2023 and July 2024 alone, the town added 6,286 residents — an 8.1% single-year increase — ranking it among the 25 fastest-growing cities in the entire United States. As of early 2026, the population sits between 88,000 and 95,000 depending on methodology, and the Town of Queen Creek itself projects a buildout population of 150,000.
The who matters as much as the how many. InvesttheQC.com — the Town of Queen Creek’s official economic development portal — reports a median age of 33.4 years, an average household size of 3.41 people, and a median household income of $155,001, placing Queen Creek among the wealthiest communities in all of Maricopa County. Seventy-seven percent of residents over 25 hold at least some college education. This isn’t a community of people who moved here because it was the cheapest option on the map. It’s a community of people who made a deliberate choice about how they want to live — and increasingly, where they want their kids to grow up.
Where are they coming from? The bulk of Queen Creek’s new residents are relocating from denser, more expensive East Valley suburbs — Chandler, Gilbert, Mesa, Tempe — where they’re being priced out of comparable square footage, or simply deciding that an extra 15 minutes of commute is worth the extra bedroom, the three-car garage, and the backyard big enough to actually use. Out-of-state arrivals are significant too, primarily from California, Illinois, and the Pacific Northwest, drawn by Arizona’s flat-tax environment and Queen Creek’s specific combination of space and school quality.
The economic catalyst that separates Queen Creek from every other fast-growing Phoenix suburb is LG Energy Solution’s announced $5.5 billion battery manufacturing complex — the single largest manufacturing investment in the town’s history. When it reaches full operational scale, it will employ thousands of local workers and, by most projections, become Queen Creek’s largest private employer by a significant margin. For buyers thinking about long-term appreciation, employment ecosystem, and community economic stability: that’s not a minor footnote. That’s a generational catalyst.
Best Neighborhoods in Queen Creek for Families in 2026
Queen Creek has more than 80 named communities. Most Realtor guides pick five and call it a day. Here’s a more honest breakdown of who each neighborhood actually serves — and a critical note that most content ignores entirely.
Before diving in, a warning that appears in almost no Queen Creek moving guide: your school district depends entirely on your exact street address. Queen Creek spans Maricopa and Pinal counties, and the same ZIP code can put two neighboring houses in different districts — Queen Creek Unified, Higley Unified, J.O. Combs Unified, or even Chandler Unified. Always verify your specific address on the district boundary map before signing anything. (Full breakdown in the Schools section below.)
A 2,147-home master-planned community (Fulton Homes) with 20+ parks, two aquatic centers with splash pads, basketball courts, and a community clubhouse. Feels lived-in and established rather than freshly painted — in a good way. Technically in Pinal County but annexed into Queen Creek for services.
Clean streets, an active HOA, and a community pool. Falls partly in Higley Unified territory — a meaningful draw. Cortina Elementary is among Arizona’s top-ranked public elementary schools by test scores. Strong value-per-square-foot for the caliber of community.
A newer master-plan community with San Tan Mountain views, extensive trail access, and resort-style family amenities. Appeals to buyers who want newer construction and a slightly less dense feel than the older south-end communities.
Queen Creek’s crown jewel for large-lot, custom-home buyers. Pecan tree canopy, genuine rural character inside a suburb, and far less HOA friction than the master-planned communities. If you’re priced out of North Scottsdale and want actual land: start here.
A gated active-adult community with golf, spa, restaurants, and a full social calendar. This isn’t your grandparents’ retirement community — it’s closer to a five-star hotel where residents also happen to sleep. The lifestyle infrastructure here is genuinely impressive.
Quieter, semi-rural character on Queen Creek’s north side. Larger lots, more open space, slightly less infrastructure density. A strong long-term value play as development continues to push north and the LG campus brings economic activity to the area.
“Queen Creek is doing something rare — it’s the affordable version of an already-affordable suburb. Gilbert was the story a decade ago. QC is the story now, for exactly the same reasons.”
Queen Creek vs. Gilbert vs. Chandler: The Numbers That Actually Matter
The question every relocating family is really asking — why Queen Creek instead of Gilbert or Chandler? — deserves a direct, data-backed answer rather than vague gestures at “community feel.”
| Factor | Queen Creek | Gilbert | Chandler |
|---|---|---|---|
| Median Home Price (2025 MLS) | ~$635K–$656K | ~$570K–$620K | ~$530K–$575K |
| Population (2026 est.) | ~88K–95K | ~294,000 | ~288,000 |
| Median Household Income | $155,001 | ~$110,000 | ~$98,000 |
| Top School District Rating | QCUSD & Higley: A | Gilbert Unified: A | Chandler Unified: A |
| Commute to Phoenix Core | 40–55 min | 25–35 min | 20–30 min |
| New Construction Available | Abundant | Very limited | Near zero |
| Dining & Nightlife | Growing but thin | Strong (San Tan District) | Very strong |
| Character | Emerging exurb, agri roots | Established suburb | Urban-suburban hybrid |
Sources: Phoenix Realtors MLS Dec 2025 · Census ACS 2024 · InvesttheQC.com · Arizona Dept. of Education 2024–25 · Google Maps commute averages
The honest verdict: if commute time and restaurant access are your primary metrics, Gilbert and Chandler win. If square footage per dollar, new construction, and schools are the priority — and your household income can comfortably carry a $635K+ mortgage — Queen Creek is the better bet in 2026. The fact that it’s still cheaper than Gilbert for comparable square footage, despite the recent price appreciation, is the core of the value proposition.
Cost of Living in Queen Creek, AZ: The Reality Check
The headline number is 18% above the national average — but that obscures a more nuanced story about where QC is actually expensive, where it isn’t, and what your money genuinely buys here.
Queen Creek’s cost of living runs approximately 18% above the national average, driven almost entirely by housing. Strip housing out of the equation, and the day-to-day cost of life here is moderate — roughly in line with most Phoenix suburbs, and meaningfully cheaper than comparable communities in California, Colorado, or the Pacific Northwest. For families making the cross-state move, this is usually a net positive once the full tax picture is factored in.
Housing: What the Numbers Actually Mean
According to Phoenix Realtors data for December 2025, the median sale price of a Queen Creek home was $635,000, while full-year 2025 MLS median came in at $655,782. The average sale price — pulled up by luxury properties at Encanterra, The Pecans, and custom estates — is higher, at approximately $756,946. New construction dominates the market; Queen Creek is one of the few East Valley communities where builders are still actively delivering product at multiple price points.
| Budget | What You Get in Queen Creek (2026) |
|---|---|
| $450K–$550K | 3–4 bed / 2–3 bath new construction in Ironwood Crossing or Meridian, ~1,800–2,400 sq ft, community pool and parks. Entry-level, but genuinely comfortable. |
| $600K–$750K | 4–5 bed / 3 bath new construction, 2,400–3,200 sq ft, 3-car garage, premium upgrades. The sweet spot for the median QC buyer. |
| $800K–$1.1M | Luxury new construction or semi-custom builds; larger lots, private pools, full outdoor kitchens. |
| $1.1M+ | Custom estate homes on acre-plus lots, equestrian properties, The Pecans and Encanterra luxury tier. |
Utilities: The Summer Reality Nobody Mentions in a Sales Pitch
No Realtor is going to hand you a July electricity bill. I will. In a Queen Creek home between 2,500 and 3,000 sq ft, expect APS or SRP electric bills of $300–$450 per month in June, July, and August if you’re keeping the house at a livable temperature. That’s not a defect — it’s the Arizona climate tax you pay for 300+ days of sunshine. Budget for it. And for the love of all that is comfortable, insulate the garage door before June.
| Expense | Queen Creek (Est. Monthly) | National Average | vs. National |
|---|---|---|---|
| Housing (mortgage on median home) | $2,800–$3,800 (owner-occupied) | ~$1,900 | ↑ ~52% |
| Electricity | $120–$200 (Oct–Apr) / $350–$450 (Jun–Aug) | ~$140/mo avg | ↑ Summer; ↓ Winter |
| Groceries | ~5–7% above national avg | — | ↑ Moderate |
| Transportation | Car-dependent; gas ~national avg | — | ≈ Comparable |
| AZ State Income Tax | Flat 2.5% | ~5.0% median | ↓ Favorable |
| Property Tax (Maricopa Co.) | ~0.59% effective rate | ~1.07% avg | ↓ Favorable |
| HOA Fees | $50–$300/mo (community-dependent) | Varies | Varies by neighborhood |
Sources: BLS Consumer Expenditure Survey · EIA Utility Data · Arizona Dept. of Revenue · Maricopa County Assessor · HOA documents. Note: Summer electricity estimates based on 2,500–3,000 sq ft homes; inference from comparable Phoenix East Valley properties where QC-specific data unavailable.
✓ Financial Pros
- Arizona flat income tax: 2.5% (among the lowest in the U.S.)
- Low effective property tax (~0.59% vs. 1.07% national avg)
- No estate or inheritance tax in Arizona
- New construction = lower early maintenance costs
- Builder incentives (rate buydowns, closing-cost credits) still available in 2026
- Strong community appreciation trajectory backed by major employer influx
✗ Financial Cons
- Housing costs ~52% above the national average
- Summer electric bills are a genuine budget line item
- HOA fees add $100–$300+/month in most communities
- New construction upgrade costs escalate quickly without discipline
- Car-dependent lifestyle = two vehicles usually non-negotiable
- Limited local dining means money spent elsewhere often requires driving
Schools in Queen Creek, AZ: What Every Moving Family Needs to Know
School quality is the single most powerful driver of home-buying decisions in Queen Creek. The news is mostly excellent — with one important asterisk that almost no moving guide bothers to explain.
Let’s start with the bottom line: Queen Creek’s public schools are genuinely, measurably excellent. This isn’t civic boosterism — it’s a statement backed by Arizona Department of Education data. For the 2024–25 school year, Queen Creek Unified School District received an overall “A” rating from the Arizona Department of Education, with 10 individual schools earning A grades. Higley Unified — which serves significant portions of Queen Creek — went one better: every single in-person campus earned an A. That’s 13 out of 13. Test scores across both districts exceeded state averages in ELA, math, and science.
Now the asterisk: which district your home falls in is not determined by your mailing address, your ZIP code, or your neighborhood’s name. It’s determined by your exact parcel address — and in a town that straddles Maricopa and Pinal counties with four overlapping districts, two neighbors can be in completely different school systems. Always verify at the district’s official boundary lookup tool before committing to a property.
The Four Districts That Serve Queen Creek
| District | State Rating | Enrollment (2025) | Notable | Best For |
|---|---|---|---|---|
| Queen Creek Unified (QCUSD) A | A | ~15,034 | 10 A-rated schools incl. Queen Creek High, Eastmark High, Newell Barney College Prep | Families in the central and southern QC core |
| Higley Unified (HUSD) A | A — every campus | ~12,351 | 13/13 in-person schools earned A; Williams Field High; exceptional ELA & math scores | NW Queen Creek, Cortina, parts of Chandler boundary areas |
| J.O. Combs Unified B− | B− | ~3,921 | Serves Ironwood Crossing area (Pinal County); improving; strong CTE programs | Ironwood Crossing, eastern San Tan Valley side of QC |
| Chandler Unified (CUSD) A | A (under review) | Serves NW edge of QC only | Casteel High is a standout; primarily serves Chandler but bleeds into QC borders | Far northwest Queen Creek parcels near Chandler border |
Sources: Arizona Dept. of Education Report Cards · GreatSchools · District enrollment data 2024–25 · Queen Creek Tribune Nov. 2025
Standout Schools Worth Knowing by Name
According to SchoolDigger rankings, several Queen Creek schools consistently land in Arizona’s top tiers. Cortina Elementary scores among the best in the state at the elementary level. Katherine Mecham Barney Elementary is another consistent standout. At the secondary level, Benjamin Franklin High School ranks 19th out of 259 Arizona high schools. Dr. Camille Casteel High School (Chandler Unified, serving some QC addresses) is consistently one of Arizona’s most-recognized public high schools for academic achievement. For families with college-bound students, these aren’t just community talking points — they’re nationally competitive institutions.
The charter school landscape adds further options: Heritage Academy (Niche: A-minus, 95% graduation rate) serves grades 9–12 and draws families from across the district boundary lines via Arizona’s open enrollment and school choice framework. Legacy Charter School within Ironwood Crossing adds a K–6 option for residents in the J.O. Combs zone who want an alternative.
Jobs and Commute: The Honest Queen Creek Calculus
Queen Creek’s employment picture is transforming rapidly — but the commute reality is the single most important variable for families not working remotely. Here’s the unfiltered version.
Who’s Actually Working Here
Historically, Queen Creek residents have worked elsewhere in the Valley — Intel, Boeing, Banner Health, State Farm, and the sprawling Chandler Technology Corridor have been the dominant employer draws. DataUSA shows that Health Care & Social Assistance, Professional/Scientific/Technical Services, and Educational Services are the top employment sectors for QC residents. But the key word is residents — most of them drive to those jobs rather than working in Queen Creek itself.
That’s changing. The LG Energy Solution battery manufacturing complex represents an investment that will, at full operational scale, generate thousands of direct manufacturing and engineering jobs within Queen Creek’s town limits. For professionals in advanced manufacturing, electrical engineering, supply chain, and logistics: this is a meaningful development. The Arizona Commerce Authority named it one of the top manufacturing projects in the nation. Construction timelines are progressing, though the full employment ramp remains multi-year.
The Commute: Actual Drive Times, Not Marketing Language
There are two versions of the Queen Creek commute story. The version in most Realtor blogs: “conveniently located near the Loop 202 and SR-24.” The honest version: you are 35–55 minutes from most Phoenix-area employment centers during peak hours, and that number gets worse before it gets better.
| Destination | Peak Hour (AM) | Off-Peak | Primary Route |
|---|---|---|---|
| Downtown Phoenix | 45–55 min | 35–40 min | SR-24 → US-60 → I-10 |
| Chandler Tech Corridor (Intel, PayPal area) | 25–35 min | 20–25 min | Ellsworth/Power Rd → Chandler Blvd |
| Gilbert / Mesa employment | 25–35 min | 18–25 min | Ellsworth Rd / Val Vista |
| Scottsdale (101 corridor) | 50–65 min | 40–50 min | US-60 → Loop 101 |
| Tempe (ASU area) | 40–55 min | 30–38 min | US-60 → I-10 / Loop 202 |
| Phoenix Sky Harbor Airport | 40–50 min | 32–40 min | SR-24 → US-60 → Loop 202 |
Source: Google Maps commute estimates; verified against community forum reports. Peak hour = 7–8:30am weekday. All figures are one-way.
Remote Work and Queen Creek: A Natural Fit
For the large and growing cohort of remote workers, Queen Creek’s commute question is largely moot — and the value proposition becomes nearly unambiguous. Broadband penetration in Queen Creek exceeds 95%, and the housing quality per dollar ratio is exceptional for home-office setups. The 4-bedroom new construction home with a dedicated office, 3-car garage, and resort-style community amenities — at a price that would get you a 2-bedroom condo in much of the coastal U.S. — is exactly the product that remote workers have been buying here in large numbers. If your employer is in San Francisco or Chicago but your body can be anywhere, “anywhere” is looking more and more like Queen Creek.
What’s Still Missing: The Honest Verdict
Every honest guide to a fast-growing town has to answer the question the marketing brochures won’t. What isn’t great about Queen Creek yet? Here’s the real list.
Queen Creek is genuinely excellent at several things: schools, parks, housing quality per dollar, community identity, family infrastructure. But it’s a town in the middle of becoming something larger than it was, and that process isn’t seamless. These are the actual friction points — drawn from community forums, resident feedback, and ground-level observation — not manufactured balance to make this article seem fair.
Traffic Has Become a Daily Reality
The resident famously quoted in an ABC15 report said it plainly: “Now, it’s a nightmare, all day long.” Queen Creek’s road infrastructure was designed for a much smaller population, and 6,000+ new residents per year is not a problem you solve with traffic lights. Ellsworth Road, Rittenhouse Road, and the Ocotillo corridor are all experiencing congestion that would have been unimaginable five years ago. The town is investing heavily in capital infrastructure — roads account for a large share of the capital budget — but construction takes time, and the population isn’t pausing while the asphalt dries.
Retail and Dining Are Playing Catch-Up
If you are moving to Queen Creek from Chandler or Gilbert expecting the same density of dining and shopping options: recalibrate. The core commercial areas — around the Queen Creek Marketplace, along Ellsworth and Rittenhouse — have solid grocery and big-box options (Safeway, Fry’s, Target, Costco nearby). But the independent restaurant scene, the walkable “downtown” experience, the variety of date-night options — these exist in early form and are improving every quarter, but they’re not there yet at the scale Gilbert’s Heritage District offers. This is a legitimate gap for families who use dining out as a primary social activity.
Summer Heat Is a Lifestyle-Defining Factor
Not a complaint — a disclosure. Queen Creek’s summers are extreme. June, July, and August routinely bring daytime highs of 105–115°F. Outdoor life between 9am and 7pm is functionally impossible during peak summer months. The parks, trails, and outdoor attractions that define Queen Creek’s appeal — Frontier Family Park, San Tan Mountain Regional Park, the Wash Trail — are April, May, October, and November experiences, not July experiences. If you’re moving from the Midwest or Pacific Northwest, this is not a weather adjustment. It’s a lifestyle reconfiguration. The flip side is 7 months of legitimately spectacular outdoor weather that most of the country can only dream about. Factor both halves honestly.
Healthcare Infrastructure Is Still Catching Up
Queen Creek has a Banner Health facility and several urgent care options, but for major hospital services, residents are still typically driving to Chandler Regional Medical Center or Banner Desert Medical Center — 25–30 minutes away. As the population approaches six figures and continues toward the 150,000 buildout projection, healthcare infrastructure will need to expand proportionally. This is a known gap the town is working to address, but it’s worth factoring into decisions for families with specific or complex healthcare needs.
✓ Queen Creek Gets Right
- School quality — genuinely among Arizona’s best
- Park system — 85-acre Frontier Family Park, San Tan Mountain Regional Park, Wash Trail
- Community identity — people actually know their neighbors here
- Housing quality and value per dollar vs. comparable East Valley cities
- Family orientation — 86% family households, massive youth sports infrastructure
- Economic trajectory — LG Energy Solution investment is transformative
- Agritainment culture — Schnepf Farms, Queen Creek Olive Mill are genuinely special
✗ Still Working On
- Traffic on major arterials (Ellsworth, Rittenhouse, Ocotillo)
- Independent restaurant and dining variety is thin vs. Gilbert/Chandler
- Summer heat eliminates outdoor life for 3 months a year
- Major hospital is 25–30 min away; local healthcare access is improving but limited
- Commute to most Phoenix employment centers is real and requires planning
- Public transit is effectively nonexistent — two-car households are the default
Frequently Asked Questions: Moving to Queen Creek, AZ
Yes — for the right household profile. Queen Creek is outstanding for families with children (A-rated schools, excellent parks, tight-knit community), dual-income couples prioritizing space and new construction, and remote workers who can trade commute time for housing quality. It’s less ideal for renters, commuters who need to be in Phoenix daily, or buyers who prioritize dining and walkability. The population has grown 56% since 2020 and shows no signs of slowing, which speaks to genuine demand rather than manufactured hype.
Queen Creek’s cost of living is approximately 18% above the national average, driven primarily by housing costs that run roughly 52% above the U.S. norm. The 2025 median home price was approximately $635,000–$656,000. Day-to-day expenses (groceries, dining, transportation) are broadly comparable to other Phoenix suburbs. Arizona’s flat 2.5% state income tax and low property tax rate (~0.59% effective) offset the higher housing costs significantly for families relocating from higher-tax states like California or Illinois.
Queen Creek is approximately 35–40 miles southeast of downtown Phoenix. The drive takes 40–55 minutes during peak morning commute hours via SR-24 and US-60. Off-peak, you can reach downtown Phoenix in 35–40 minutes. The Chandler Tech Corridor — which hosts major employers like Intel, PayPal, and Wells Fargo — is considerably closer at 25–35 minutes. The SR-24 extension, when complete, will further improve Valley connectivity.
Queen Creek is served by multiple school districts depending on exact address: Queen Creek Unified School District (QCUSD, state A rating), Higley Unified (A rating — all campuses), J.O. Combs Unified (B-minus, serves Ironwood Crossing area), and a small portion falls under Chandler Unified (A rating). Both QCUSD and Higley Unified students consistently outperform state averages in ELA, math, and science. Always verify your specific parcel address with the district boundary lookup tool before purchasing.
Median home prices are actually slightly higher in Queen Creek (~$635K–$656K) than in Gilbert (~$570K–$620K) for 2025 MLS data. However, Queen Creek delivers significantly more square footage per dollar, more new construction availability, and larger lots than Gilbert at comparable price points. Gilbert’s older housing stock commands premiums for its closer-in location and more developed amenity scene. For buyers prioritizing new construction and space, Queen Creek offers better value per dollar; for those prioritizing established neighborhood character and closer commutes, Gilbert competes effectively.
Queen Creek is known for its combination of agricultural heritage and modern master-planned suburban living. The Queen Creek Olive Mill — an award-winning working olive farm with a restaurant and tasting room — and Schnepf Farms (one of Arizona’s largest peach growers and host to a beloved annual fall festival) are its most iconic landmarks. The town is also increasingly recognized for its outstanding public schools, Frontier Family Park, proximity to San Tan Mountain Regional Park, and as one of America’s fastest-growing communities.
For families with school-age children, Cortina (partly in Higley Unified, close to Cortina Elementary), Hastings Farms (newer master-plan, mountain views, strong amenity base), and The Villages at Queen Creek (established golf-course community with strong value) are top choices. Ironwood Crossing offers exceptional value with 20+ parks and two aquatic centers, though it falls under J.O. Combs Unified rather than the A-rated districts. For luxury buyers, The Pecans offers large custom lots with pecan canopy, and Encanterra serves the 55+ market with resort-level amenities.
Queen Creek consistently ranks among Arizona’s safest growing suburbs. The town’s relatively affluent, family-oriented demographic profile (median household income $155,001; 3.75% poverty rate) and active HOA culture in most communities contribute to low crime rates. The community forum character — neighbors knowing neighbors, active engagement in local social networks — reinforces informal safety. As with any rapidly growing community, specific micro-locations vary, and the standard advice of researching crime data at the address level using the Queen Creek Police Services portal applies.
Very hot. Queen Creek experiences a desert climate with summer highs routinely between 105°F and 115°F in June, July, and August. Heat index can push higher. Monsoon season (July–September) adds humidity and spectacular lightning storms. Most outdoor activity is practical only before 9am or after 7pm from June through early September. The trade-off: October through May delivers some of the most pleasant outdoor weather in North America, with consistent sun, mild temperatures, and zero snow or ice to contend with.
The Queen Creek market in early 2026 is more balanced than the pandemic-era frenzy — homes are spending an average of 92 days on market (down from 2025 peaks), and the median price dipped slightly year-over-year to $635,000. Builder incentives including rate buydowns and closing cost contributions remain available in the new construction market. For long-term buyers (5+ year horizon), Queen Creek’s LG Energy Solution economic catalyst, infrastructure investment, and population trajectory support a positive long-term view. This is not a timing-the-market question so much as a lifestyle question — if Queen Creek fits your life, the 2026 market is reasonable entry territory.
Is Queen Creek “The Next Gilbert”? An Honest Answer.
The comparison to Gilbert — made in a dozen Realtor blogs, local news pieces, and community forums — is both accurate and slightly misleading. Gilbert in 2014 was a fast-growing suburb with excellent schools, an emerging identity, and a housing market that rewarded early buyers handsomely. Queen Creek in 2026 shares those characteristics. Where the analogy starts to fray: Queen Creek has a deliberately different character than Gilbert ever did. It’s larger in area, more spread out, more mixed in its housing stock and terrain, and sits next to actual mountains rather than flat desert plain. It’s not becoming Gilbert — it’s becoming something distinctly itself.
What is that something? A town of families who made a conscious choice to live differently than the denser, busier East Valley offered them. A community with one foot in Arizona’s agricultural soul — the Olive Mill, Schnepf Farms, the pecan groves — and one foot in its most modern suburban expression: master-planned neighborhoods, A-rated schools, industrial-scale economic development. It’s a place where a dad can teach his kid to fish five minutes from a brand-new house, where the mountains are close enough to hike before work, where the neighbors still wave. And it’s a place that is, still, becoming — which means the best case for buying here is partly a bet on what it’s still in the process of building.
That’s a good bet. Moving to Queen Creek, AZ in 2026 means joining a community at an inflection point, with every major indicator — population, income, schools, economic investment — pointing in the same direction. Just make sure you’ve got a good sun shade for the car windows.
Ready to go deeper? Explore our Georgetown, TX Real Estate Guide for a comparison to another high-growth Sun Belt suburb, or check out our North Port, FL Relocation Guide for what the relocation boom looks like on the Gulf Coast.
© AmeriCurious · americurious.com · Last Updated March 27, 2026 · Data refreshed annually
Discover more from AmeriCurious
Subscribe to get the latest posts sent to your email.